 I enjoy developing and making things using the tools of statistics and programming.
I believe research is only as valuable as how well you are able to communicate it.
I enjoy developing and making things using the tools of statistics and programming.
I believe research is only as valuable as how well you are able to communicate it.

GitHub Home

Welcome to my GitHub page! My name is Michael Siebel and I am a data scientist at Fors Marsh Group. Feel free to click the links below to see some of my public projects.
Bad Banking Behavior
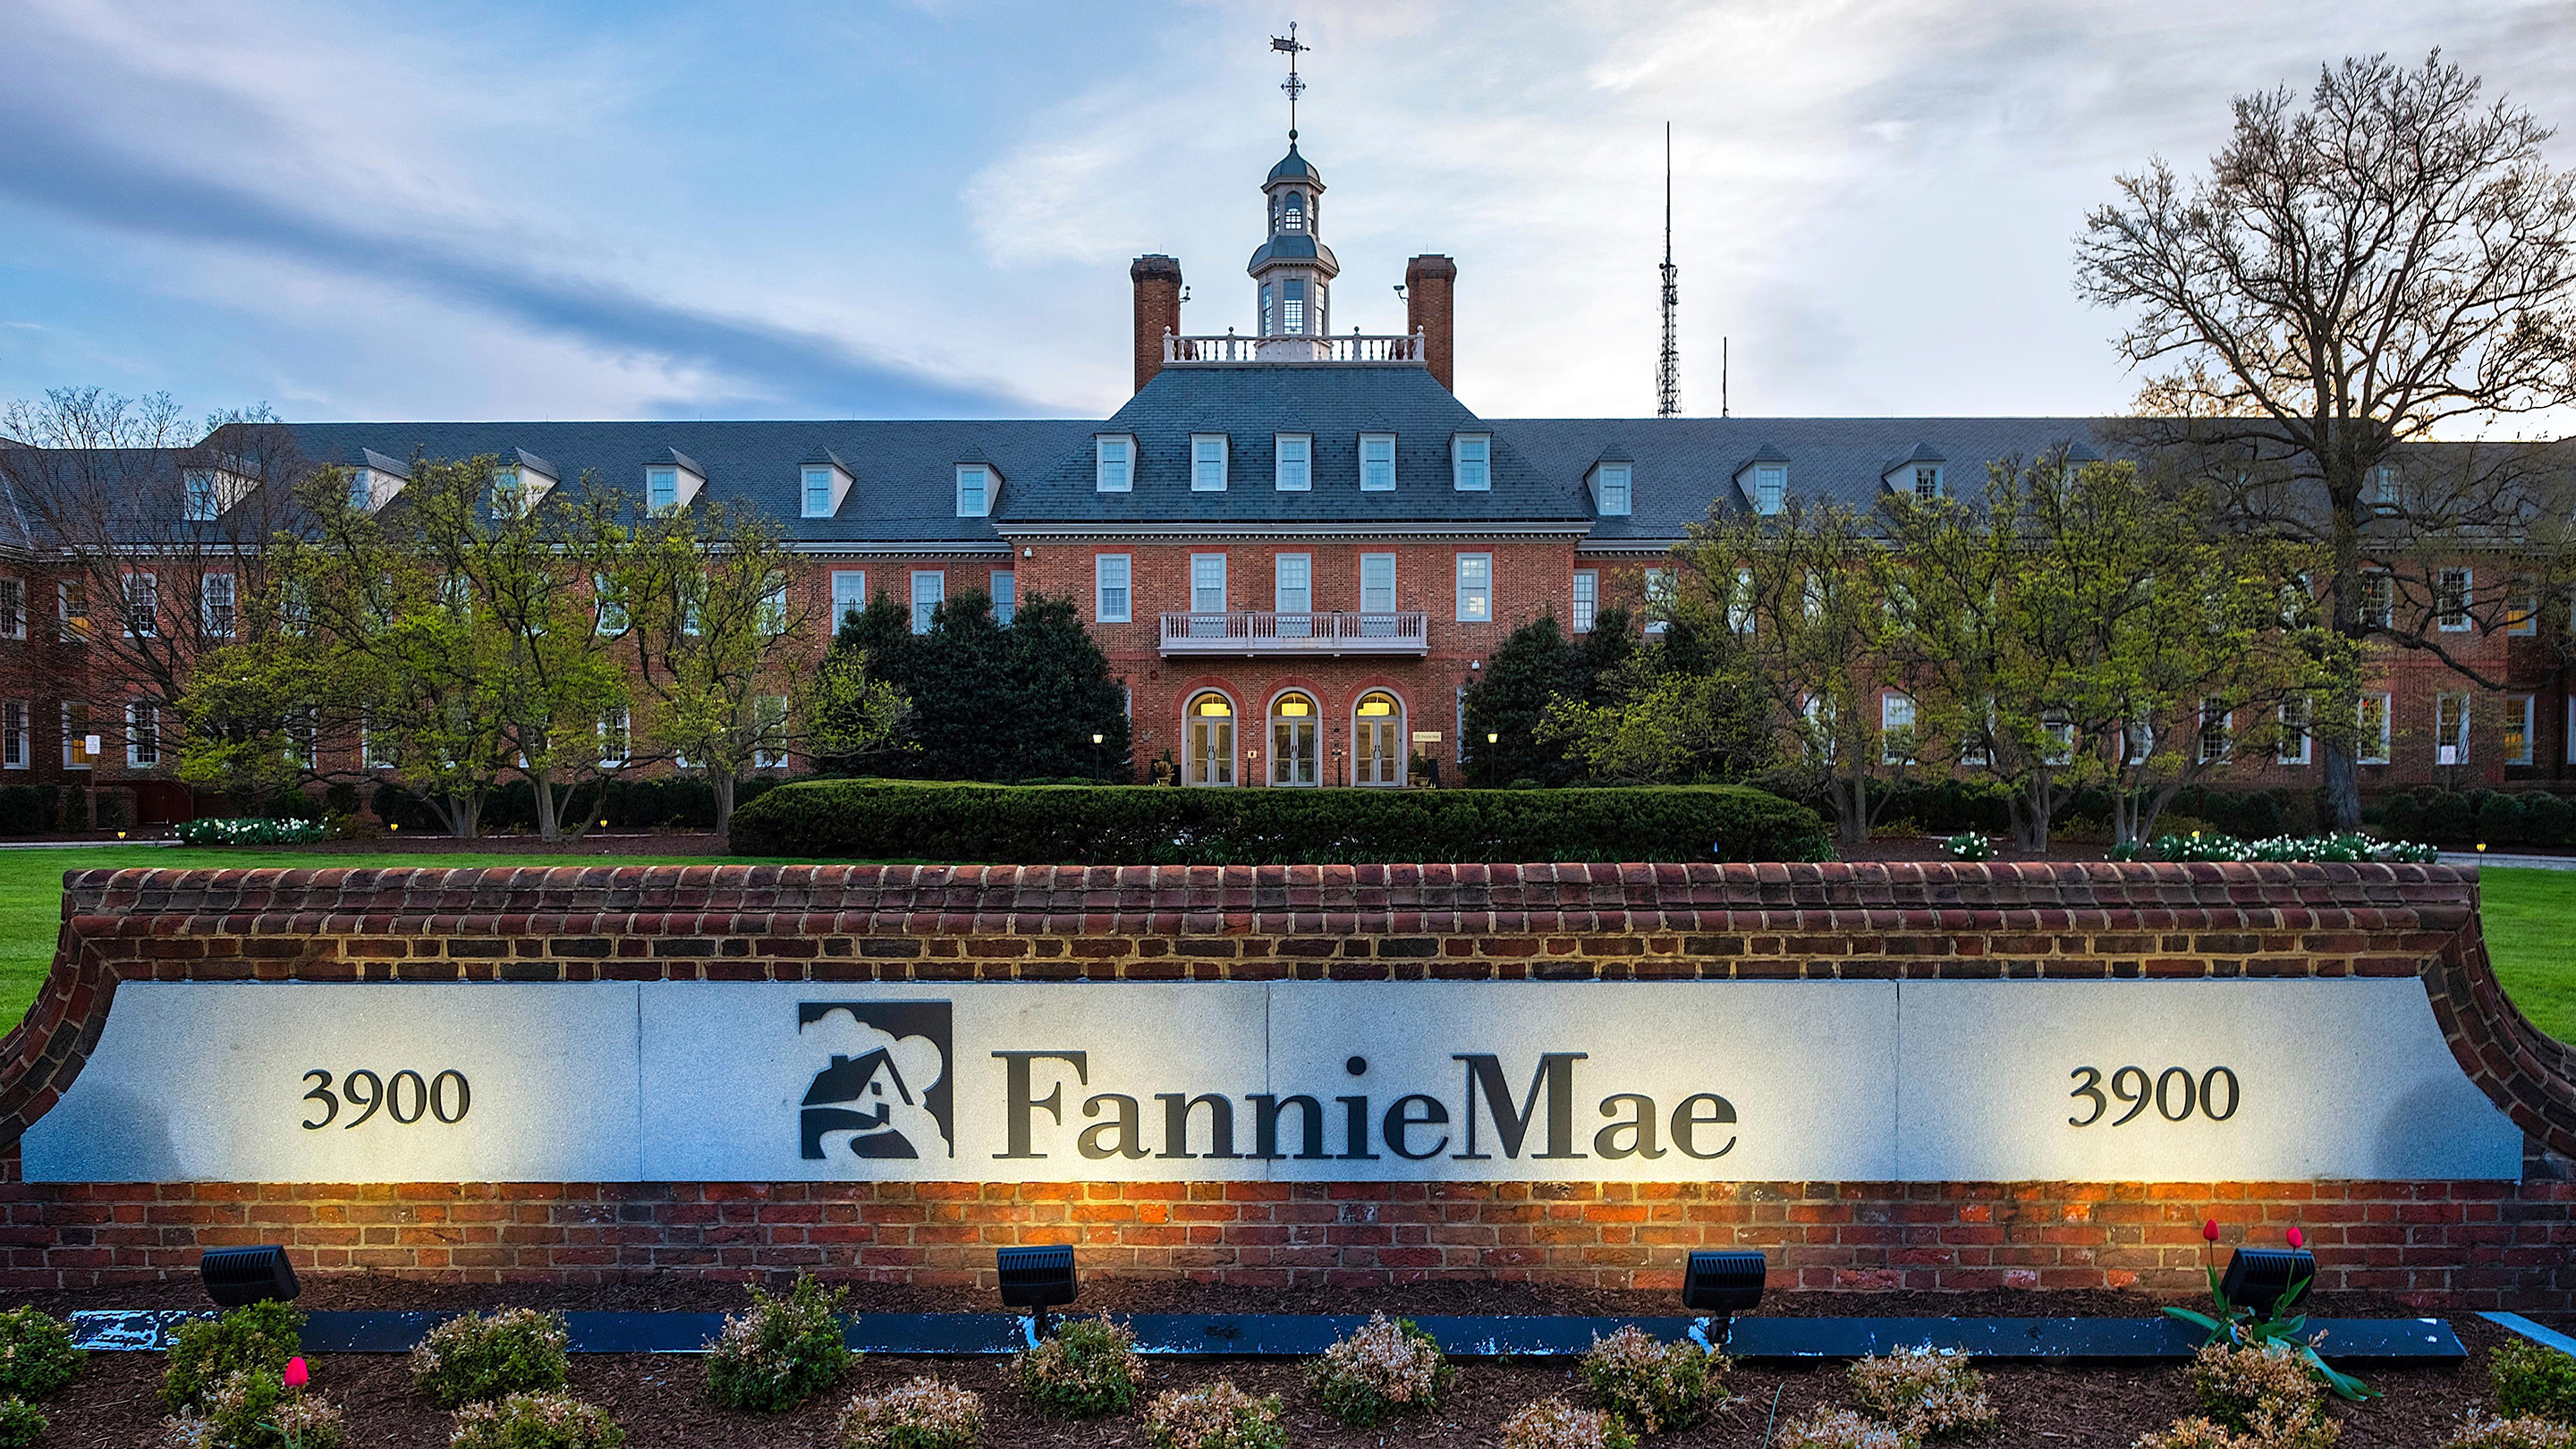
It has been over a decade since a mass sell-off of single-family mortgage loans and housing foreclosures popped the housing bubble and plunged the global economy into a financial crisis. I investigated the behavior of the nine largest banks during the housing bubble and alternative scenarios in which better behavior could have led to fewer foreclosures.
GIF Tutorial in R

A tutorial of how to create GIF's using R.
I take look at a few GIF vinettes featuring three potential utilitarian purposes. Then, I view some applied examples. Finally, I look line-by-line at the code ourselves.
Python Tip #7: Reproducing Stata's Standard Errors

Lately, I have been recreating Stata estimates using Python. In this tip, I reproduce Stata's (and R's survey package's) robust standard errors it uses in its prop and mean commands.
Trump's Twitter Sentiment

Dashboard of President Trump's twitter account. Displays sentiment of tweets overall and by topic area including news media, policy agenda, Russian investigation, and party politics.
Python Tip #6: Webscrapping
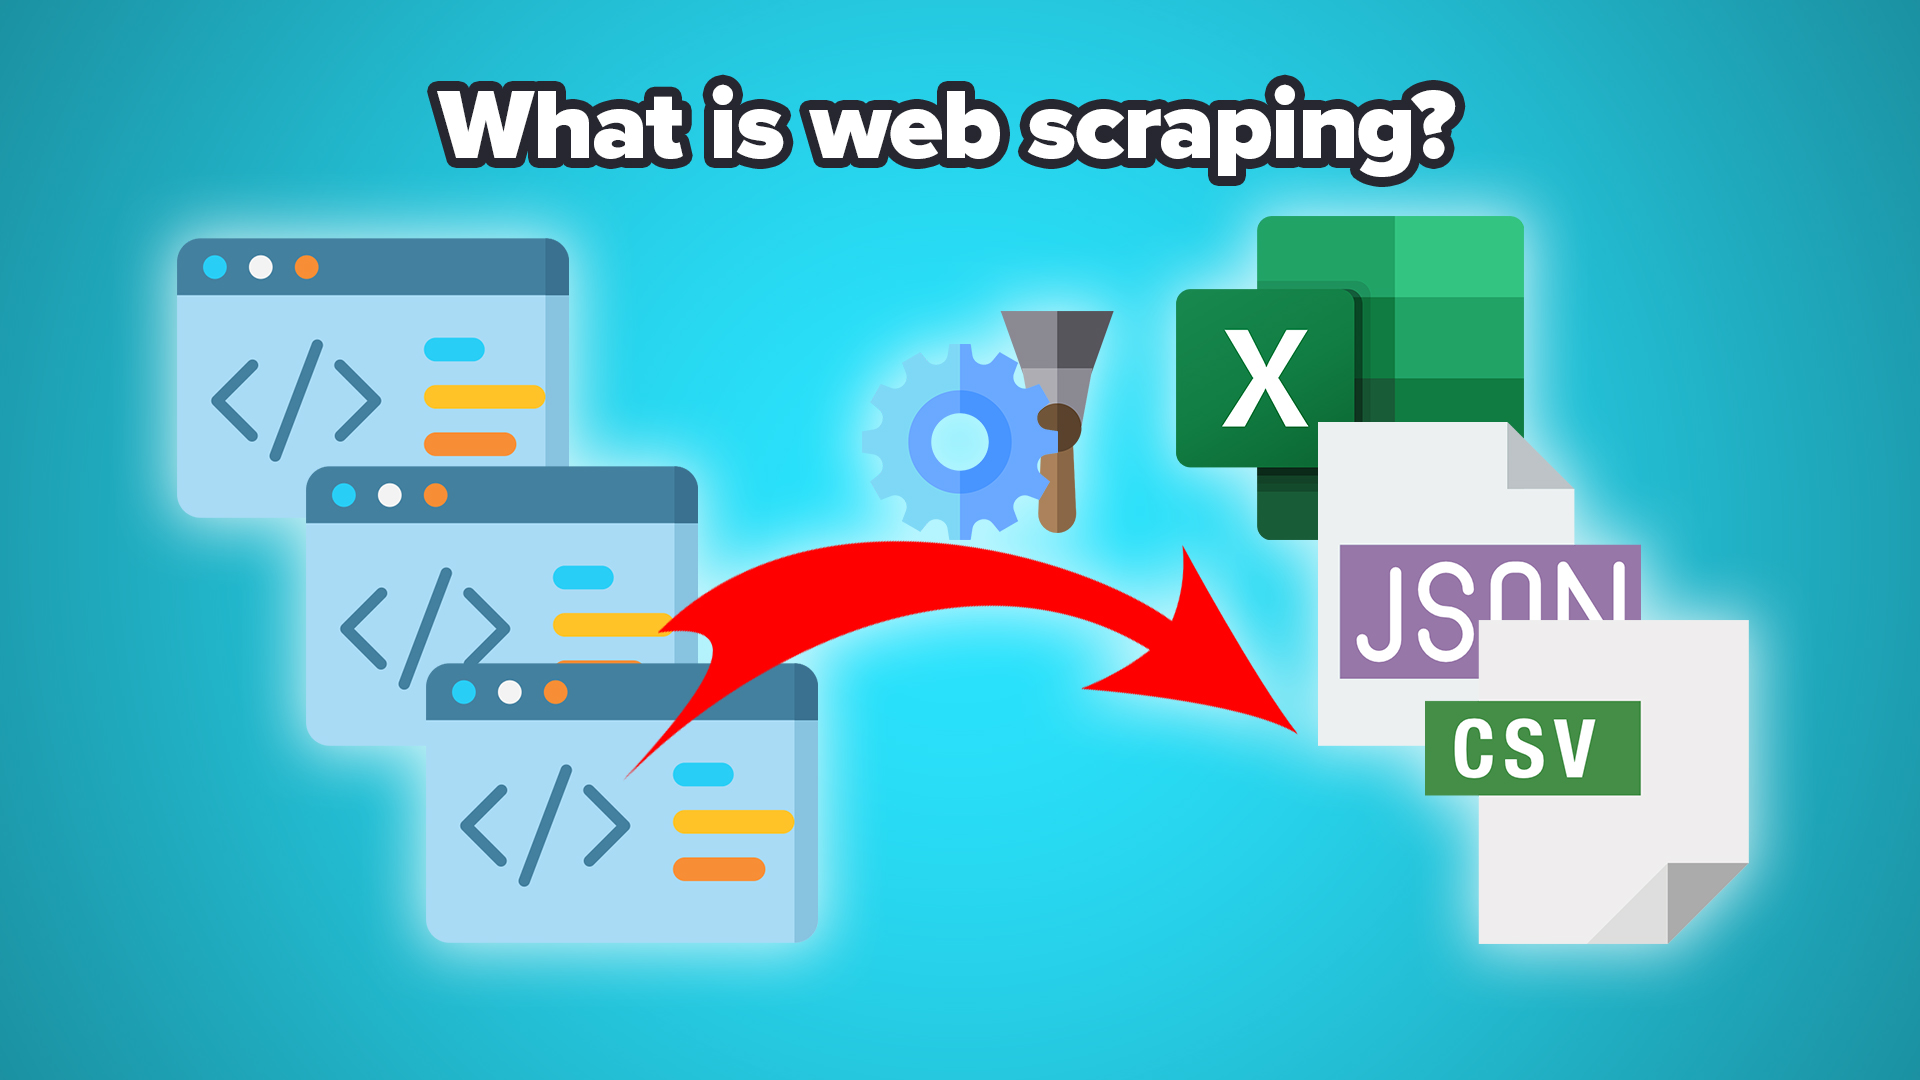
Webscrapping is a very important skill to learn if you are interested in natural language processing. While webscrapping text requires a strong understanding of HTML and CSS, webscrapping tables does not involve much understanding of HTML and CSS.
G-20 Military Spending

Dashboard of military spending of G-20 countries and comparisons of this spending against domestic priorities in education and health care spending.
Python Tip #5: Indexing

When it comes to data wrangling, perhaps the key distinction between different software is how they index data frames. In Python (using Pandas), every data frame has to have at least one index. An index is a row that contains values to help users identify a row. Just like columns have names, rows need to have names (although these "names" can and often are integers).
Harry Potter and the Basic Text Analysis

Exploring the text of the Harry Potter book series using natural language processing techniques in R.
It seeks to find answers to the questions:
Python Tip #4: Logistic Regression

This post will go through the standard sklearn process of running a logistic regression. We will rerun Tip #3's code to load IRIS as a toy dataset..
Dealing with Rare Events
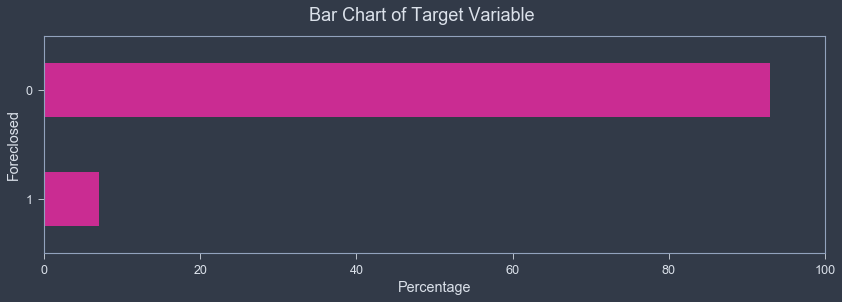
A demonstration of modeling rare events in Python.
Using Fannie Mae mortgage data, I investigated which types of loans are at greatest risk of default (i.e., being foreclosed upon) at the beginning of the 2008 financial crisis. This is made difficult as loan defaults, even at the height of the financial crisis, was a "rare event", meaning it occurs at such a low frequency that a model becomes far better at predicting what DOES NOT cause a default compared to what DOES cause a default.
I test how downsampling and upsampling techniques can improve predictions of rare events.
200 Countries, 200 Years
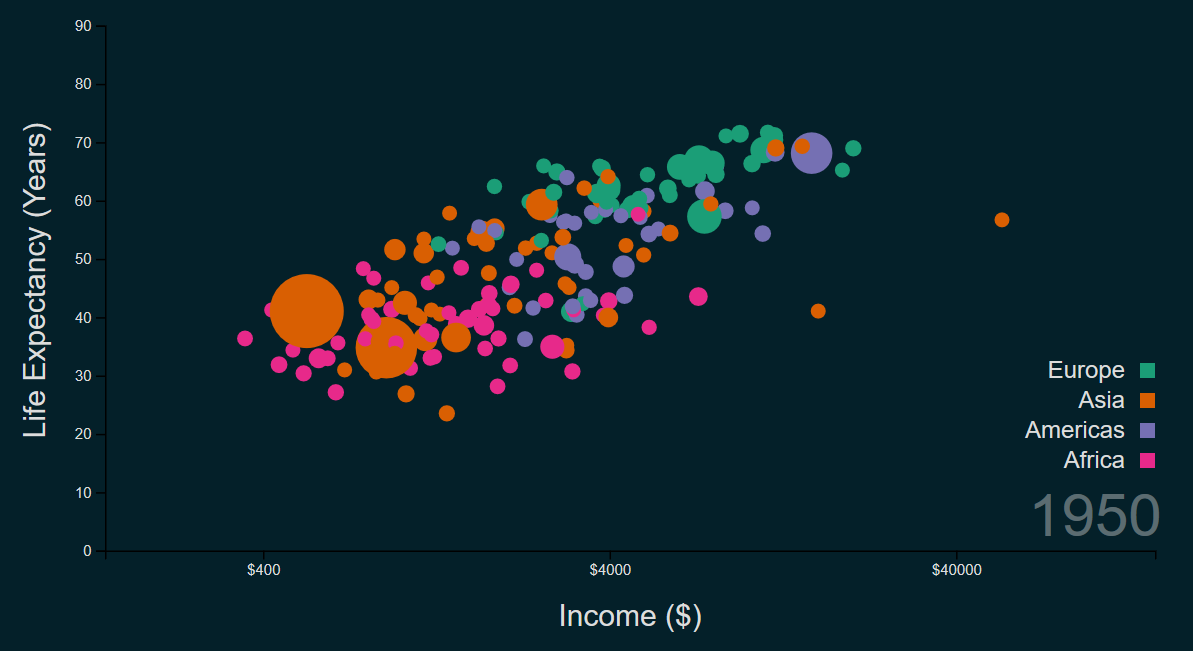
A simple recreation of Hans Rosling's famous lecture in d3.js.
Harry Potter and the Sentiment Analysis

Exploring the tone of the Harry Potter book series using natural language processing techniques in R.
It seeks to find answers to the questions:
Parallel Processing Primer
A demonstration of the parallel package for parallel processing in R.
U.S. Baby Names
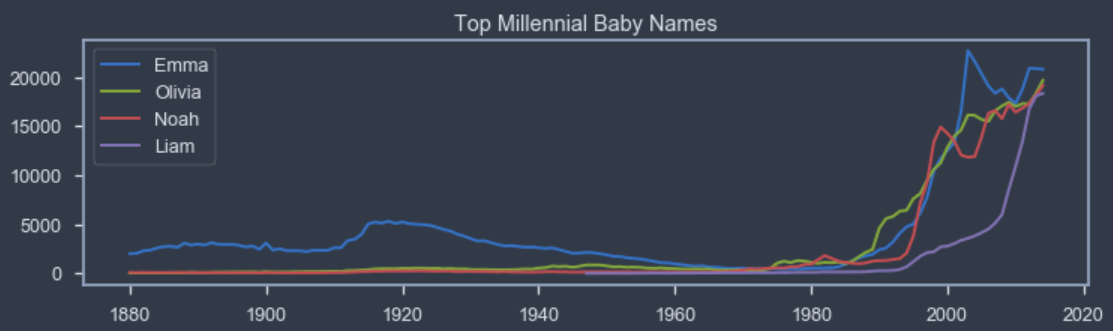
A demonstration of mining baby names by year in Python.
I show how the Python packages Pandas and Matplotlib can be used to create tables and charts of the popularity of baby names.
Names Millennials give their babies and my family's names are mined.
Python Tip #3: Toy Datasets
Practice with sklearn and vega datasets.
Vectorized Loops
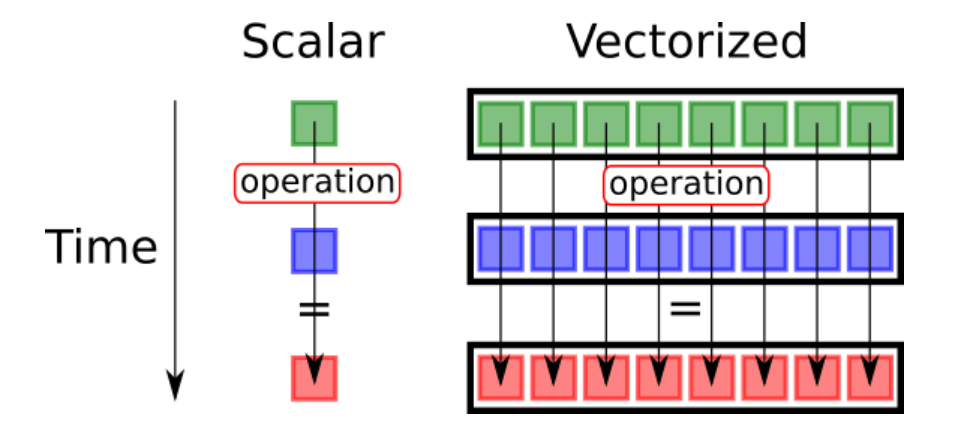
Vectorization is the process of converting an algorithm from operating on a single value at a time to operating on a set of values. Vectorized functions are necessary for distributive computing tasks.
Python Tip #2: Grouping Multilevel Data

Let's say you have data on individuals such as personal income, and want to use that data to create an average at a higher level such as a State average of personal income. For Python, you would group the variables using the Pandas function groupby() and calculate the new values using the Pandas function transform().
Creating a GIF of a Log-Sigmoid Curve
A demonstration of how to create GIF's using R.
Creating a GIF in ggplot is extremely simple and only requires one additional package beyond ggplot2.
I show how the R package gifski can be used to convert a series of plots into a GIF of a Log-Sigmoid curve.
Python Tip #1: Help Function

The most import function in any programming language.
Get in Touch
If you’re interested in my work or would like to collaborate, I encourage you to connect with me on LinkedIn, or email me at michaeltsiebel@gmail.com.
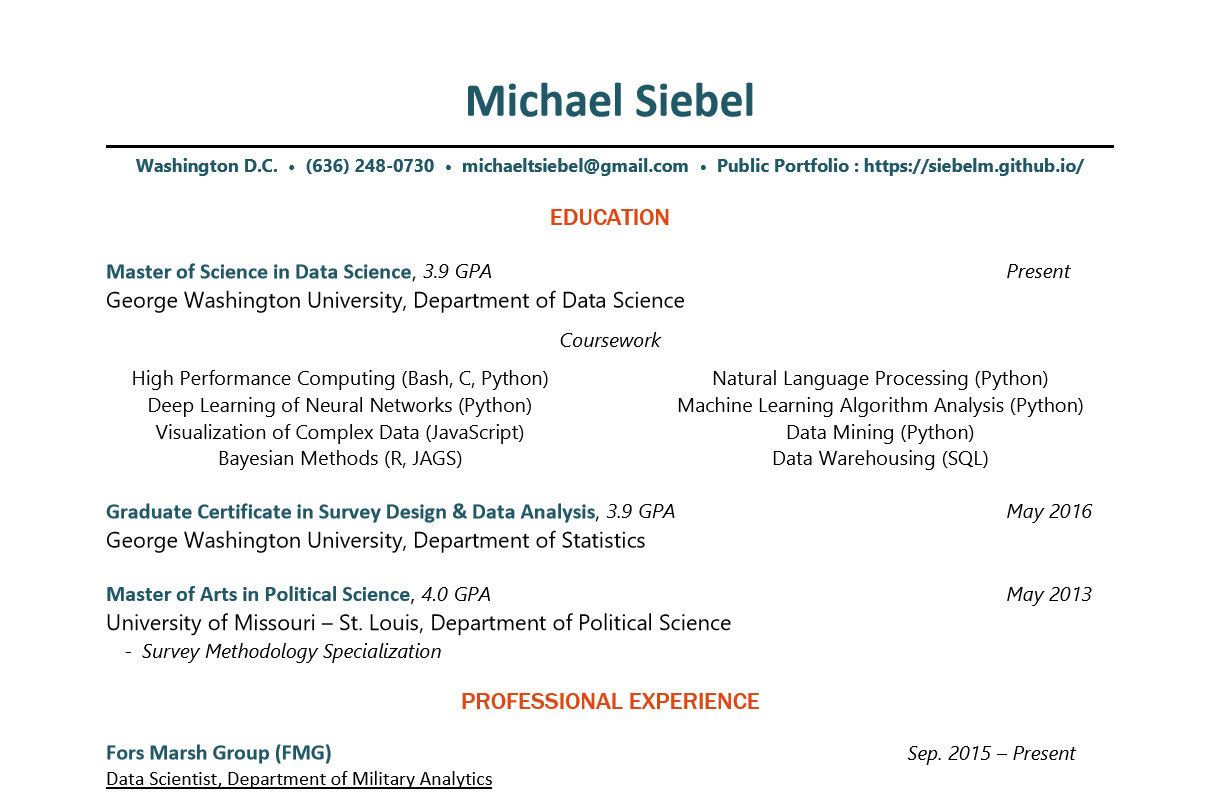
For more detailed information, please view my resume by clicking the photo above.